It has been a long while since we discussed financial ratios. The last post was more than 10 years ago (although it was edited in 2016). Today we hope to discuss Tobin's Q and how it can help us in our fundamental analysis. First let's define what the heck is this ratio about.
From Wikipedia:
Tobin's q (also known as q ratio and Kaldor's v) is the ratio between a physical asset's market value and its replacement value. It was first introduced by Nicholas Kaldor in 1966 in his article "Marginal Productivity and the Macro-Economic Theories of Distribution: Comment on Samuelson and Modigliani".
It was popularized by James Tobin, a Nobel laureate who did creative and extensive work expenditure decisions, employment, production and prices in finance. He famously stated:
1) the numerator, is the market valuation: the going price in the market for exchanging existing assets.
2) the denominator, is the replacement or reproduction cost: the price in the market for newly produced commodities. We believe that this ratio has considerable macroeconomic significance and usefulness, as the nexus between financial markets and markets for goods and services.
There are various formula for Tobin's Q and one of which is the basic price-to-book ratio. But the version that I think makes the most sense is the following:
Courtesy of Investopedia
There is a full explanation on investopedia so I will not go into the details here. As with price-to-book, the concept is that a company's market value (i.e. stock price or market cap) should approximate its replacement cost and therefore the ratio should always be close to one. Alas, as stock prices go, it is everything but.
Today, price-to-book ratios usually go into teens for good companies (which is the usual level for price-to-earnings in the past) and in most analysis, it is no longer a useful measure. What is more important could be free cashflow, price-to-earnings (the starting point is usually teens and we try to determine whether 30x is too expensive) and growth rate.
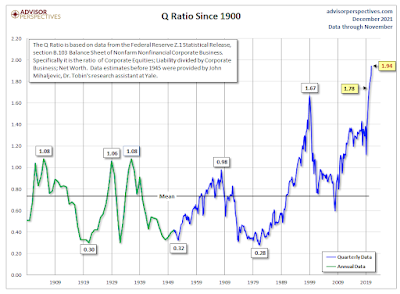
Tobin Q can also be used for the entire stock market. Since 1945, the Federal Reserve publishes a quarterly Z.1 Statistical Release which provides the raw data for the q ratio's calculation. There is also data using different sources before that. For more details, please refer to the following salient update from Advisor Perspectives:
What is important with such ratios usually is to compare the numbers across its history. The following chart shows that the Tobin's Q ratio is at its highest level ever. This is even higher than the level reached during the dotcom bubble for the entire US market. There is argument that the raw data understates the denominator, as such, the ratio rarely dipped below 1x over the last 20 years, but still, we cannot say the market is cheap or fairly price. We are quite far from that.
Courtesy of Advisor Perspectives
A lot of luminaries are saying we are in the mother of all bubbles, this ratio is another datapoint confirming the danger. It pays to be prudent now. Be fearful when others are greedy, but this time, cash may not be the safest hiding place, so we may need to diversify. It might be worthwhile to look for companies trading below 1x their Tobin's Q ratio and many other asset classes including gold, crypto or hard assets.


No comments:
Post a Comment