With the new Cabinet in place and the WP working hard to defend what they have won, it is time to get back to real investment! Today we look at our favourite ratio again!
PE or price earnings ratio has been talked to the death on this blog. This is more to just summarize the various ways to look at this ratio, or rather, how many in the investment community looks at it.
1. Cheap or Expensive
The PE ratio, first and foremost, is the quickest way to determine whether a stock is cheap or not. It is obviously not the best way, as most source will give the PE based on next year's earnings. Now why should it based on 1 yr's earnings is beyond me, given that business and the economy in general tend to go through cycles. In any case, we have discussed this about a million times. Here are a few of the earlier posts:
PE Ratio
Earnings yield
2. Shiller PE
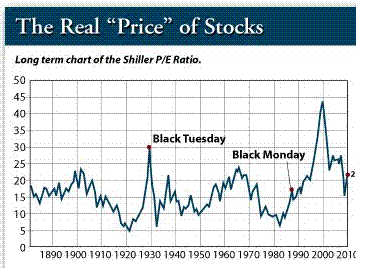
Well it appeared that it wasn't just me who thought that PE should be based on some long term earnings instead of just next yr's. So some professor named Shiller calculated PE based on 10 year's worth of earnings. Before him, of course, the Grandfather of Value Investing: Ben Graham had already advised everyone to use 10 year average in the 1960s. Sadly, nobody bothered. Well at least today Prof Shiller continues to maintain the database of PE based on 10 yr's earnings and below is the chart.
From the chart, you can see why no broker would want define PE using 10 year earnings. Bcos it shows you there is about 3 times in the last 100 yrs where stocks were truly on bargain, 1920, 1931 and 1982.
There is about 10 times where you can buy at 10x PE, which is still quite cheap, over the last 100 years. If you are a true value investor and you know it's risky to buy over 15x, basically, this chart tells you that you shouldn't have bought anything in the last 20 years.
So is it a wonder why nobody showed us this kind of PE calculation?
Ok you might argue that if this Shiller calculation did nothing in the last 20 years, and we missed that bull run in dotcom, and during 2006 and 2007 when China was the bull and the bulls were all in China, then maybe we shouldn't be looking at it at all?
That is true, but I guess the main purpose of using such conservative ratio would be to protect against any risk of losing a lot of money. The Shiller PE would more or less guarantee you that you will not lose money if you bought when it showed 10x. It cannot tell you to buy at 15x hoping it will go to 40x.
Next post we look at the other faces of PE!

