Showing posts with label Financial Ratios. Show all posts

Friday, April 08, 2022

Tobin's Q: The q ratio

It has been a long while since we discussed financial ratios. The last post was more than 10 years ago (although it was edited in 2016). Today we hope to discuss Tobin's Q and how it can help us in our fundamental analysis. First let's define what the heck is this ratio about.

From Wikipedia:

Tobin's q (also known as q ratio and Kaldor's v) is the ratio between a physical asset's market value and its replacement value. It was first introduced by Nicholas Kaldor in 1966 in his article "Marginal Productivity and the Macro-Economic Theories of Distribution: Comment on Samuelson and Modigliani".

It was popularized by James Tobin, a Nobel laureate who did creative and extensive work expenditure decisions, employment, production and prices in finance. He famously stated:

1) the numerator, is the market valuation: the going price in the market for exchanging existing assets.

2) the denominator, is the replacement or reproduction cost: the price in the market for newly produced commodities. We believe that this ratio has considerable macroeconomic significance and usefulness, as the nexus between financial markets and markets for goods and services.

There are various formula for Tobin's Q and one of which is the basic price-to-book ratio. But the version that I think makes the most sense is the following:

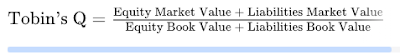
Courtesy of Investopedia

There is a full explanation on investopedia so I will not go into the details here. As with price-to-book, the concept is that a company's market value (i.e. stock price or market cap) should approximate its replacement cost and therefore the ratio should always be close to one. Alas, as stock prices go, it is everything but. 

Today, price-to-book ratios usually go into teens for good companies (which is the usual level for price-to-earnings in the past) and in most analysis, it is no longer a useful measure. What is more important could be free cashflow, price-to-earnings (the starting point is usually teens and we try to determine whether 30x is too expensive) and growth rate.

Tobin Q can also be used for the entire stock market. Since 1945, the Federal Reserve publishes a quarterly Z.1 Statistical Release which provides the raw data for the q ratio's calculation. There is also data using different sources before that. For more details, please refer to the following salient update from Advisor Perspectives: 

What is important with such ratios usually is to compare the numbers across its history. The following chart shows that the Tobin's Q ratio is at its highest level ever. This is even higher than the level reached during the dotcom bubble for the entire US market. There is argument that the raw data understates the denominator, as such, the ratio rarely dipped below 1x over the last 20 years, but still, we cannot say the market is cheap or fairly price. We are quite far from that.

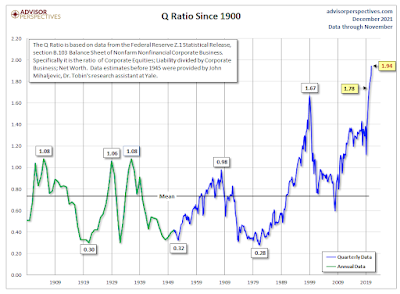
Courtesy of Advisor Perspectives

A lot of luminaries are saying we are in the mother of all bubbles, this ratio is another datapoint confirming the danger. It pays to be prudent now. Be fearful when others are greedy, but this time, cash may not be the safest hiding place, so we may need to diversify. It might be worthwhile to look for companies trading below 1x their Tobin's Q ratio and many other asset classes including gold, crypto or hard assets. 

Tuesday, September 29, 2009

Cost of Capital

This post is edited in 2016.

We are back to talking about something dry after a long, long hiatus. Ok Cost of Capital.

Basically, capital is not free, it comes at a cost.

Why is there such a cost? Well basically the person providing the capital needs to earn a return. If not, he might as well chuck it under his pillow right?

So the question is how much return does he want?

Well, the lowest return he can get without any risk of his original amt being reduced is 3% or so. That is if he buys government bonds. So the cost of capital cannot go below 3%.

Capital actually comes in two forms: debt and equity. Let's talk about the cost of debt first, bcos it's easier.

Debt
Say you want to start a company today and need money, so you go to a bank and ask for a SME loan. Depending on the nature of your business, your bargaining ability, the desperation of the loan officer, your interest on the loan should be around 6-10%, which is pretty high. Well that's bcos it's SME, may go any time one. So the bank needs some buffer. If a big Fortune 500 firm issues a bond, they can probably get US$100mn with interest rate of 4+% or so.

So the cost of debt is just that: 4% to maybe 6% for most large cap companies. In 2016, with negative interest rate dominating a lot of sovereign bonds, the long term cost of debt has come down to 2-6% for corporates.

Equity
Traditionally it has been thought that cost of equity should be higher than debt bcos the equity provider gets to participate in the upside (when the profit grows, stock price rises) but the debt owner will always only receive the fixed interest. So cost of equity will at least be 6% or more. In the 1950s or maybe 60s, academics tackled this question in a big way and came out with a huge model called the CAPM model. This is huge and Nobel prizes are given and economists became gods. For those interested, you can go wiki it or something.

Basically the idea is that cost of equity can be expressed in an equation like

Cost of equity = risk free rate + equity risk premium

The equity risk premium part can be further broken down into super complicated stuff like beta and expected market return which are too mind-boggling for our purposes here so it suffice to say that this equity risk premium should be a no. to compensate equity investors for the risk they take and make the total cost of equity higher than cost of debt.

Historically, cost of equity is about 8-10% for most large cap companies.

So the equity risk premium is about 5-7% (bcos risk free rate, which is usually long term government bond yield is about 3%)

Combining the two, you get something called the WACC (for weighted average cost of capital), and this is the cost of capital for a company. This no. usually ranges from 6-8% judging by the no.s given above.

It is said that companies should earn more than its cost of capital to justify its existence. So meaning the co. should have a return on capital of at least 6-8%. Capital meaning debt + equity, or roughly speaking total asset of the company (not exactly the same thing but close). If the co. has no debt, it means that the return on equity (the famous ROE), should jolly well be above 8-10%, ie above the cost of equity.

If a company cannot generate this return, then investors should really pull out all the funds and invest in others that can. However, in real life, that is not always the case, as we shall explore in the next post.

Saturday, December 27, 2008

Enterprise Value and Free Cash Flow II

This is a continuation of the last post talking about EV and FCF.

A company generates cashflow based on its day-to-day operations. Eg. SIA selling air tickets with fuel surcharges 2x actual ticket prices. The millions of ticket sales generate cash. Of course SIA needs to pay the pilots, the stewardesses, the fuel, landing charges etc. After netting the expenses, it should still have cash left. Some co.s don't, if you own some of these, good luck! Anyways, this no. is called Cashflow from Operations.

Next, SIA needs to spend some of this cashflow on equipment to maintain its operations. Like buying new planes, pilot training programs, etc. This no. is called Capex which is the short-form for capital expenditure.

When you deduct Capex from Cashflow from Operations, you get a no. called the Free Cash Flow. Basically, that's what's left that can be distributed to shareholders or to pay down debt. If the company has no debt, it's basically money that can be paid to the shareholders.

Over the course of many many years (like 10 yrs or more), a good co. will generate significant Free Cash Flow and has the capacity to even grow this amt over time. Now finally, things are getting interesting right? These are co.s that value investors look out for. Usually, I would look at that past 10-15yrs of FCF and take an average amt to use that to calculate EV/FCF. I am assuming that the company can generate this average FCF in the future for many many years.

Let's look at SIA. Over the past 10 years, SIA has 5 yrs of positive FCF and 5 yrs of negative FCF. Cumulatively, it generated a miserable S$175mn of FCF. Our ministers' salaries over 10 years would have generated as much. This is what the most profitable airline in the world can manage. Moral of the story: Don't ever buy an airline!

Combining the two things, you get EV/FCF which is just a measure of the cheapness of the company. The lower the better, like the PE ratio. If this ratio gives 5x, it means that theoretically, you get back your money in 5 yrs. Usually it doesn't get cheaper than that. EV/FCF ranges from 5-15x usually.

Again, back to SIA, the EV is S$8.8bn based on current stock price of S$11+. Calculating EV/FCF give 8800/175 = 50.3x. If you buy SIA today, the free cashflow generated should be able to cover your purchase in about 50 yrs. That's great isn't it? Maybe just in time to cash out and pay for the funeral expenses!

Sunday, December 21, 2008

Enterprise Value and Free Cash Flow I

Once upon a time, we talked about a radical ratio called EV/EBITDA which was invented and nearly won the Nobel Prize in Most Innovative Financial Ratio ever invented. Well someone topped that and invented EV/FCF which is Enterprise Value over Free Cash Flow.

What's so great about EV and its alphapetical soup of acroynms? Ok, let's define the terms first.

EV = Market cap + Net Interest bearing debt
FCF = Cashflow from Operations - Capex

For the uninitiated, pls follow the hyperlinks and read what is Market Cap, Cashflow from Operations etc. I will explain EV and FCF.

EV stands for Elise Vuitton, cousin of Louis Vuitton who recently came out with her own luxury brand of leather bags to grab share from the legendary LV.

Oops, wrong number. Ok, here's the real deal.

EV is sort of the theoretical takeover price of a company. In the event of a buyout, an acquirer would need to pay the market price (or market cap) to the existing shareholders. However he would also have to take on the company's debt, but pocket its cash (hence looking at NET interest bearing debt is impt). If a company has no debt and some cash, then EV is less than market cap and the acquirer will be getting a bargain!

Actually in today's market, some co.s are trading below net cash! This means that EV is actually negative. You get paid to buyout some co.s listed on SGX! It goes to show how irrational things can get when markets go crazy. However, as quoted by the great Keynes: markets can stay crazy longer than you can stay liquid. Well usually also longer than you can stay patient lah. Nevertheless, having said all that, it goes to show that markets today are really cheap. This is the Great Singapore Clearance Sale value investors have been waiting for! But wait tomorrow things can get cheaper though.

Anyways, that's EV. In the next post, we shall explore Free Cash Flow or FCF.

Sunday, January 13, 2008

Free Cash Flow Yield or FCF

One advanced but quite useful financial ratio that has not been discussed on this blog is the Free Cash Flow Yield. This no. tries to determine how much return can an investor expect after the company has made its money and invested what it needs for future operations. It also gives an indication of how much the dividend yield could be.

This ratio is not called an advanced ratio for nothing. For those who think investment is easy, well sorry, you have to read maybe 5-6 posts on this blog in order just to understand this one. I have added the links on all the keywords. Anyways, here's the basic.

A company generates cashflow based on its day-to-day operations. Eg. a hawker selling bar chor mee gets money fr his customers. This no. is called Cashflow from Operations.

Next, he needs to spend some of this cashflow on equipment to maintain its operations (bowls, knives, noodle cutting machine etc.) This no. is called Capex which is the short-form for capital expenditure.

When you deduct Capex from Cashflow from Operations, you get a no. called the Free Cash Flow. Basically, that's what's left that can be distributed to shareholders or to pay down debt. If the company has no debt, it's basically money that can be paid to the shareholders.

Next we try to compared Free Cash Flow or FCF with the stock price. So you divide FCF by no. of shares. You get the Free Cash Flow per share. This is similar to dividing Net Profit by the no. of shares to get the EPS.

And finally, you divide the FCF per share by the stock price to get the FCF yield. This is similar to EPS divided by stock price to get the earnings yield, the inverse of the all-famous PE ratio. So we all know, the higher the earnings yield, the better, bcos it means more return of investors. Similarly the higher the FCF yield means more money back to investors.

Empirically FCF yield of 5-8% would indicate that the co. is quite good in terms of managing its cashflow and capex. If you get lucky you may find co.s with 10-12% FCF yield. What this means is that this business keeps churning out cash and yet you need not invest in a lot of new stuff to keep it going. This is the kind of businesses that value investors like. See's Candy would be an example that Buffett would place here. In Singapore, I think Vicom would be a good example. No. of cars keep increasing, but not much new investment needed to check more cars.

Sadly, I would guess that 30-40% of all listed co.s would have a negative free cash flow yield, bcos most businesses require a lot of capex just to keep going. The prime example would be semiconductor and/or tech businesses. Every few yrs, technology advances and companies just have to keep investing just to stay competitive. 6" wafers to 8" then to 12". Everytime to inch size changes, all the eqmt have to change. Is it a wonder why Chartered cannot make money?

So that's FCF yield, a good indicator of whether the co. is good or bad at generating cashflow for investors. But it's quite troublesome to calculate this and usually stock screens don't have this ratio easily available although it's on Bloomberg.

Tuesday, August 21, 2007

Which EPS to use? (for calculating PER)

We are back to my favourite topic on PER (Lao Jiao value investors are yawning right?). But I think I need to clarify one issue on PER (which stands for Price Earnings Ratio) which I KIVed for some time. For the un-initiated on PER, pls refer to this post.

Ok in short, PER is simply stock price divided by its earnings per share and it measures the cheapness of a stock. The stock price does not tell you anything about whether the stock is cheap or not!

Now to determine Price is easy, this is the all impt Price that you get from TVs, Yahoo, Your broker's system. Singtel is $3.30, SMRT is $1.75, even grandmas know this.

But EPS? Where to find this? And which year's EPS should we use?

For the sake of newbies, we go back to Finance 101. EPS is actually the net profit for the company for the year, divided by its no. of outstanding shares. These no.s are usually inside the company's annual report.

However, things published in annual reports are dated, ie. We can only get last yr's EPS. In the stock market, nobody likes to look at the past. The market is always forward looking. So we need to know next yr's EPS.

This next yr's EPS is usually an average of all the analysts' estimates which are usually not available for most folks but are easily accessible from financial service providers like Bloomberg, Reuters and Thomson One.

As convention, the PER that is usually quoted is the 1-yr forward PER (ie. Next yr's PER using analysts' estimates of 1-yr forward EPS). But for growth stocks, ie. the company is growing its profits really fast, then the 1-yr forward PER is usually too ex. Then you need to look at 3-yr forward or even 5-yr forward PER so that it gets reasonably cheap.

But it's always very dangerous to use such futuristic PER bcos the probability of error will be very very big. You may think that you are buying a 10x 5-yr forward PER stock but if the company fails to grow in its 3rd and 4th year, then Ha Base, 10x become 30x PER and the stock plunge 60%!

As for value investors (or rather any prudent investors), we should be determining what is the long-term sustainable EPS and hence what is the PER of the stock today.

There is no magic formula here to help you predict the long-term sustainable EPS. For the professional investment analysts, they talk the company's management, study their markets, do some research and analysis and try to come up with a sustainable EPS, and still usually get them wrong. So for the simple folks, what's the chance that you can get it right? Not much higher than winning Toto.

Nevertheless, that doesn't mean that you shouldn't try though. Bcos when you can get an estimate for this EPS, and apply a margin of safety, if the stock is still reasonably cheap after that, then probably it's safe to buy. But with investment, nothing is for certain, so you may still be wrong. Well at least, you learn from your mistakes.

Saturday, July 07, 2007

Return on Equity, Episode III (ROE-EP3): Du Pont Decomposition

Return on Equity can be broken down into three different parts. This famous decomposition is known as the Du Pont Decomposition. Does it have to do with the chemical giant Du Pont? Probably yes, but for those interested, you can go Google and Wiki it up, now we are at the climax of the trilogy, so let’s move on. Recall that:

ROE = Net Profit / Shareholders’ Equity

This can be broken down into

ROE = Net Profit / Sales x Sales / Asset x Asset / Equity

Mathematically, this makes no sense as Sales and Asset are all cancelled out, why include them in the first place? Engineers cannot understand this. But when we break down ROE into these three elements, ROE can be re-written as

ROE = Net margin x Asset Turnover x Leverage

There are still a few twists and turns to the climax of this trilogy but to cut the story short it simply means that ROE is impacted by these 3 things

1) Net margin (which is Net Profit / Sales)
2) Asset Turnover (which is Sales / Assets)
3) Leverage (which is Asset / Equity)

In order to increase the company’s ROE, we just need to improve either one of the 3 things mentioned above.

We can reduce cost, hence even if sales remains the same, net margin goes up, ROE goes up. We can increase asset turnover, i.e. by making our existing asset work harder to generate more sales. Or we can increase debt.

Now (1) and (3) are easy. For (1) you just fire a whole bunch of people, make the rest work harder, or hire 10,000 cheap workers from emerging countries to replace those you fired. For (3), it is even easier, just borrow more. By borrowing, you increase the liabilities that your co incurs thereby increasing your asset base (usually as an increase in cash) which can translate into more sales and profits if those cash or assets are used correctly and hence ROE goes up.

To improve ROE by improving (2) i.e. increasing Asset Turnover is one hell of a job. I have got a post on that. Read this! Basically, when you see a company with high ROE, it pays to see how this high ROE came about. If it is due to high debt, then maybe it’s a Decepticon! So beware, there is more than meets the eye!

If it is due to either (1) or (2) then, probably it’s still ok. But if you see a company’s ROE improve over the years and it’s due to only (2), increase in Asset Turnover, then give the management some respect. It’s a job well done! And it is time to load the truck with stocks of this company!

Saturday, June 23, 2007

Return on Equity, Episode II (ROE-EP2): A company’s organic growth rate

ROE can also be used to gauge a company’s organic growth rate. This means how fast the company can grow without relying on external factors like M&A, gahmen support, tax relief, Toto winfall, father mother sponsorship or anything else other than its own profits.

Remember that Net Profit, though a volatile no. due to multiple manipulation from sales, to operating costs, to interest and tax, does measure the profit that should go to shareholders if the accounting is done with integrity. And Net Profit is actually added to Shareholders’ Equity at the end of the year.

So Return on Equity or ROE which is

Net Profit / Shareholders’ Equity

tells you how the growth rate of shareholders’ equity has been, in the past 1 year. Now if past ROE is a good gauge for future ROE, we can then assume that next year’s Shareholder Equity will grow exactly by its ROE right? Savvy huh! This is the critical part, usually, high ROE will not last into the future bcos things always mean revert. But if you tracked this particular Co. which had ROE of 20% for the past 20 yrs, then maybe you can quite safely assume next year it will be 20% as well. Btw, ROE of 15-20% is sort of a long term average that things mean revert to. If the Co. has like ROE of 50%, then probably it will mean revert to 20% after some time.

Ok, analogy time. Say Co. X has a ROE of 20% for the past 20 yrs and shareholders’ equity of $100 at the end of Year 20. Since ROE has been 20% for donkey years, we can assume that it is also 20% in Year 21. And Voila, it IS 20% and Co. X earns $20 in net profit. Assuming the Co. X pays no dividend, this $20 is then added back to shareholders’ equity at the end of Year 21 and so Co. X shareholders’ equity becomes $120. In Year 22, Co X again earns 20% of $120 in net profit which will again be added back to its shareholders’ equity and become $144. Shiok huh!

So as you can see, ROE measures the growth rate of the company’s shareholders’ equity if the company does not distribute out net profits as dividends. (If it does, the growth rate simply becomes ROE x (1 – payout ratio), where payout ratio is between 0-100%.)

So when a company has an ROE of 20% and can maintain that, it means that the company can grow its equity base organically by 20% every year (i.e. without relying on M&A etc). Sounds attractive right? This is another reason why people look at ROE so much.

PS: Shareholders’ equity can grow by 20% per year doesn’t mean that stock price will also grow by 20% per year, There is difference between performance of the company and the performance of the stock!

See also ROE Part I

Wednesday, June 13, 2007

Return on Equity, Episode I (ROE-EP1): Beating the Cost of Equity

That's a cool title! Agree? Anyways, this is probably the last important financial ratio that I have not touched on. You are wondering just how many financial ratios did Wall Street come up with right? Well this is different, this is the famous ROE and its equally famous Du Pont decomposition, chim huh?

Ok, Return on Equity or ROE measure the return that can be earned by the portion of shareholders’ money in the company. Mathematically, it is defined as

Net Profit / Shareholders’ Equity

This is totally different from earnings yield so pls don’t get confused. ROE has to do with the financial performance of the company while earnings yield deals with the performance of the stock. Over the long run (i.e. very long lah, like 20 yrs or more), both should converge, but fundamentally they measure different things.

So why is ROE important? Bcos it measures the profitability of the company with respect to shareholders’ funding. Equity capital comes at a cost (just like debt) and a company with a low ROE runs the risk that it cannot earn its cost of capital (equity in this case) and this means that the company is in deep shit.

As an analogy, say Investor T decides to invest in this Company S and T demands a 8% return over the long run. If you are asking why 8%, don’t ask bcos it introduces a lot of chim stuff like CAPM and more Nobel Laureates which will make it quite complicated. So let us save that for another post.

So T wants 8% but say this S is actually quite crappy and can only do 5% return. This means that T is not adequately compensated for investing in S bcos S is a in a risky business and T might as well have put the money in a bank or perhaps invest in a structured product tied to the growth rate of ministers’ pay which could have given T 8% return or more. So that’s bad news for S bcos equity funds will pull out and S may have to cease operations. So in order for S not to cease operating, it must has a ROE at least as high as its cost of equity.

In other words, a company should earn its cost of equity in order to justify its existence to shareholders. The higher the ROE, the easier for the company to earn its cost of equity and the better the company is as an investment. This concept can be expanded to the cost of capital of the company, where we bring in the cost of debt together with the cost of equity. So a company has to earn a return more than its cost of capital to justify its existence to both shareholders and debtholders.

There are other ways to look at ROE and we shall examine them in later posts.

Wednesday, May 23, 2007

Back to basics: Price to X, where X equals earnings, sales, cashflow etc

A lot of first-time readers to this blog has feedback that a lot of issues discussed here are too complicated and difficult to understand. I must stress that it is always easier to start reading from my earlier posts and then build on from there as your understanding of the concepts improve.

Nevertheless, to make it easier for new value investors wannabies, I will re-visit old topics to help illustrate the concepts (paiseh to the old-timers here, I will try to add new insights into these re-visit posts as well)

So the topic to revisit today is Price to X, where X equals earnings, sales or cashflow etc. In the earlier post, we talked about the most famous one of them all, Price Earnings Ratio or PER. Today let’s try to further understand this ratio and also try to examine the other siblings.

The price of the stock, as we know, is meaningless. SIA is $18, SMRT is $1.9, SGX is $8. It tells you it cost $18,000 to buy 1 lot of SIA but that’s as helpful as telling you that a property in Istanbul cost 200 million Lira. You have no idea whether it’s expensive or cheap right? (Unless you are a Turkish property agent who specializes in Istanbul and know the SGD Lira exchange rate.)

Everything needs to put into perspective. In the stock market, the convention is to divide the stock price by something else. This something else can be sales, earnings, cashflow etc. This is analogical to the psf used in property. Price is divided by floor size so that a common basis for comparison can be established.

So for the case of the Price Earnings Ratio or PER, Price is divided by the Earnings Per Share or EPS of the company. The lower the PER, the cheaper the stock. (same for property, the lower the psf, the cheaper.) Historically PER ranges from 10x to 40x for whole markets and 2x to 1000x or more for individual stocks. My rule of thumb is if the stock’s PER more than 18x, I think is too expensive for me and I won’t buy the stock if even has the most wonderful growth story.

In the heydays of the dot com boom, most companies don’t have earnings so the Price to Sales ratio was invented to gauge whether the dot com company is cheap or not. Analysts got so ingenious that someone even came up with Price to Eyeballs ratio i.e. Price of stock divided by no. of eyeballs viewing the website. Like that also can!

Of course after Enron and other multi-billion fraud cases, people started to realize actually earnings may not be reliable bcos co.s can always cook their books. So they look at Price to Cashflow, bcos co.s can make up earnings but cashflow is presumably harder to manipulate. Or so they thought!

Friday, April 06, 2007

Forward PER

PER may be a simple concept but its application can actually be quite complicated. For those who need some refresher course on the PER, it is the Price Earnings Ratio of a stock. It tries to determine the cheapness of the stock by dividing the stock price by its earnings per share (or EPS). For more info, read this post.

Now the issue here, which have never really been discussed in detail in this blog all thanks to this blogger who conveniently left it out, is which EPS should we use to calculate PER? Is it the latest historical EPS announced by the co.? Or what?

The answer is the expected EPS in 1 yr's time (not announced by the co. yet, i.e. it is not in the annual report). The resultant PER is also called the forward PER. The reason is very simple. The stock market always look forward, not backward. It is the culmulation of the expectations of all the players in the market. Hence when using the expected EPS of the stock in 1 yr's time to calculated PER, we roughly get a good sense of the market's expectation of the value of the stock.

BTW, this expected EPS (also called the consensus EPS) is usually the average of all the sell-side analysts EPS estimates for the next year and this no. can be easily pulled off bloomberg or other financial information providers. Now of course you may argue, sell-side is good-for-nothing and their estimates are usually wrong. Then naturally you can do your own homework and come out with your own expected EPS in 1 yr's time and use that to calculate the stock's forward PER. Well that won't be too hard right?

Also, you may ask why 1 yr? Why not 2 yr or 10 yr? Well actually you can use any year you want, if you can forecast correctly the EPS of the stock in 10 yr's time. You should use that. For some business, you can, and you should. But when you are looking at a stock for the first time, it would be easier to get the consensus EPS estimate and get a rough sense of the stock's forward PER. As a rough gauge, I would consider anything less than PER 18x as cheap and I would not buy any stocks that is trading at more than PER 18x.

See also Price to book ratio

Tuesday, December 12, 2006

Dividend yield


For a list of dividend stocks (as of Jan 2009), see Free Cash Flow and Dividend Stocks.

Dividend yield is the stock dividend per share (DPS) divided by its share price. E.g. if Company A gives 10c dividend in 1 yr and its share price is $1, then its dividend yield is 10%.

Alas, as we can guess, it is very unlikely that a stock will be able to sustain a 10% dividend yield for long periods. The simple reason being that if it does payout 10% handsomely forever, why would the original owners list the company? They might as well keep it private and keep the 10%. There are times when the market collapse and dividend yield hits 10% but it is unlikely to remain cheap for long as the stock would rebound quickly. But if you do find one in the current market, let us know! So that we can all buy. Huat Ah!

Globally market dividend yield ranges from 2-4%, but some individual companies do give much higher yield (usually that also mean the company has not much growth prospect). In Singapore the average dividend yield is also around 3-4%, which is not much higher than fixed deposit rate, but actually quite ok by global standards.

Personally I think dividend is very important because it may be the only form of incremental income for a value investor (who prefers to buy and hold stocks). If a company does not pay dividend, there is no way to get cash out of your investment except by selling the shares. But if you would like to hold the shares because you think the company will continue to grow, what can you do? Value investors also need cash to buy groceries right? Not much use holding on to stock certificates until you are one leg into the coffin, isn't it?

Also, by paying dividend, the company shows that it has its shareholders in mind. Excess capital is always returned to shareholders if it cannot be put into better use. Of course, a growth co. needs ALL the money to invest and grow, and they don't pay dividend. Investors sometimes take that excuse, but usually also taken for a ride. However some growth company do grow big and when they are ready, they pay dividend as well, e.g. Microsoft.

However, Berkshire Hathaway has never paid dividend since Singapore got independent because its owner-manager, our hero Warren Buffett, thinks that he can use put the money into better use. And he has done that.

Since most if not all companies are not like Berkshire, we should expect them to return investors some of the money the firm has earned.

See also Company cheatsheet
and Earnings yield

Monday, October 30, 2006

Earnings yield

Earnings yield is the reciprocal of the Price Earnings Ratio or P/E Ratio or PER. For those mathematically inclined, well you know what's a reciprocal, as in not "you love someone and someone love you back" that kind lah.

For those who thought that it was "you love someone and someone love you back", umm ok you are wrong and here's the correct formula:

P/E Ratio = Share price / Earnings per share (EPS)
Earnings yield = Earnings per share (EPS) / Share price

or

P/E Ratio = Mkt cap / Net Profit
Earnings yield = Net Profit / Market cap

If you still having problems, try reading a few related posts below.
1) Price Earnings Ratio
2) Market Cap
3) Net Profit

Ok, now that we know what is Earnings Yield, let's try to examine it further. Now if you think about it, Earnings Yield is actually the return that you can get by investing in this stock. Say if a stock has an Earnings Yield of 10%, it means that by investing $100 in the stock, you would get $110 back by the end of the year.

Now if you get this, cheaper P/E means higher return right? Because Earnings Yield of 10% would mean that the P/E of the stock is 10x. (10% = 0.1 and reciprocal of 0.1 = 10.) And P/E of 10x is damn bloody cheap because it means that the stock can give you 10% return p.a. and as we all know (hopefully) investment on average earns you 5-8% over the long run.

Consider NOL, which trades at P/E of 3x, it means that its earnings yield is 33%. Sounds like a screaming buy right? Actually, it is a huge debate right now, nobody knows the answer. This is because no one is sure that the P/E can remain at 3x, say 5 yrs from now. This means that some players in the market think that NOL may lose truckloads of money in the next 5 yrs. And he is not willing to buy it now, even if NOL is super cheap today.

As with intrinsic value and forward PER (i.e. P/E ratio in the future) guesswork is involved here. And the guesswork is the usually the one thing that determines whether you will lose truckloads of money or not. Well investing is not easy, I guess. Earnings yield is just another tool to try to make solving a 10 trillion step equation 1 step easier.

See also What drives stock prices
and Expectations vs Reality

Thursday, October 19, 2006

EV/EBITDA

As I have mentioned before, on Wall Street, when one no. is divided by the other, cults are formed. This ratio is behind one of the biggest, most controversial cult around. Why is it so? First, because it is very difficult to pronounce. It has 5 syllabus. There are only about 10 words in Singlish with 5 syllabus, so most Singaporeans won't be able to pronounce it, including the blogger who writes this blog.

EV/EBITDA, pronounced as (EE-VEE-EE-BIT-DAH) tries to measure the cheapness of a stock. i.e. similar to other valuation metrics like PER or PBR. Pls do not try to pronounce it as EVITA, I know it is very tempting but pls don't. Regardless of whether you are a fan of Madonna or Britney Spears.

EV stands for Enterprise Value which is the value of the entire firm to both shareholders and debtholders. Its formula is shown below:

EV = Market Cap + Net Debt
Market Cap = Read this post
Net Debt = Total Debt - Cash

And EBITDA stands for Earnings Before Interest, Tax, Depreciation and Amortization. Whatever that means. Well for those really interested, read this post. For those really not interested, well let's just say EBITDA tries really hard to measure some kind of profit (not the kind most good old value investors would like lah).

So, in essence, EV/EBITDA tries to measure the intrinsic value or cheapness of a company, just like PER or PBR. But it looks at it from the perspective of both the shareholder and the debtor. (The other two ratios only look at it from the shareholder's perspective.)

On top (the numerator), it takes into account both market value (or market cap) of the company, and its debt. At the bottom (the denominator), it looks at profits before interest, tax and even depreciation. Well from this ratio's creator's point of view, this is profit attributable to both the shareholder and the debtholder.

So, there you have it, a new ingenious ratio, and a cult is born. EV/EBITDA followers now flood the markets. Rituals are performed now and then when analysts hold hands and chant EV/EBITDA 20 times, and the leader shouts "hip hip", and the rest let out "hurray". Like Singapore secondary schools' sports day.

Ok, just kidding, shit like this don't happen anymore. Singapore secondary schools have moved on to Queen's "We'll Rock You", which used to be a JC thingy. But here's what's really important. EV/EBITDA ranges from 5-25x nowadays with fair value usually at 10-15x.

See also Financial Ratios
and SWOT analysis

Tuesday, September 12, 2006

Asset Turnover

Asset Turnover is probably one of the most important ratios that Wall Street invented but ironically also the most overlooked because it's regarded as not-so-sexy and desperately needs some extreme makeover.

If Asset Turnover is so ugly then why is it important then? Well, Greenspan is ugly too in case you didn't notice. But his fart affects the lives of millions, if not billions.

Asset Turnover measures the revenue that can be generated by $1 of the firm's asset. i.e. how much money can be made from $1 of asset. It is calculated by dividing Sales over Total Assets. Do not under-estimate significance of this ratio. If only you knew its power...

Ok, so much so for the lousy parody. To increase the firm's Asset Turnover while keeping Asset constant requires operational efficiency improvement. This cannot be done if the company is slack or has a lousy management.

This ratio also has some weight partly because both its components no.s are large no.s and large no.s are not easy to manipulate. (e.g. you can make your OP increase by 50% easily by pushing back some costs, but you cannot increase your sales 50% or decrease your assets 50% overnight.)

But this also means that comparison between different companies gets tricky. You get into situations when you try to compare Asset Turnover of Firm A at 1.0614x vs that of Firm B at 1.0615x. So which is better? You can't really say for sure, unless you are a Nobel Laureate for Applied Rocket Science for Not-So-Meaningful Financial Ratio Calculation.

Hence Asset Turnover may be useful only for historical comparison. If the Asset Turnover of a company has improved from 0.9x to 1.1x, you know that it has successfully generated more sales for every dollar of asset. This no an easy feat, especially if companies are already operating at full capacity. If they can increase Asset Turnover while at full capacity, it means that they somehow can make their existing facilities work harder (by streamlining processes or making existing pool of workers work harder etc) to generate the extra revenue.

However Asset Turnover cannot be used for companies that does not generate its revenue from tangible assets. (e.g. online businesses with no assets to speak of.) In such cases, we have no choice but to return to more popular measures like ROE or OP margin

See also Fixed Asset and Depreciation

Wednesday, August 16, 2006

Financial ratios

In Singapore, when you divide one no. by another, it is usually to achieve some specific purpose and you will forget all about it in like 2 seconds. E.g. you go to a restaurant with 12 friends and when you get the bill, you simply divide it by 12, and forget all about it.

On Wall Street, when you divide one no. by another, it has divine meaning. Cult leaders and religious factions are formed. So much so that some no.s have an ® mark beside them. And R stands for Religion.

Ok R does not stand for Religion, but it is true that some no.s when divided by another has an ® mark beside them. These no.s are also known as financial ratios.

Wall Street thinks that by divided one no. by another, you can normalize things and hence comparison can be made for different co.s. Much as I despise Wall Street, I think that sometimes ratios make sense. E.g. when I divided the dollar value of all the presents I bought for my wife by the no. of times I skip washing dishes, I can determine the efficiency of the presents. It works out to be $12.6 for per dishwashing session. Anyone needs some financial planning on dishwashing?

Anyway, below is a non-exhaustive list of financial ratios and their meanings.

1) Operating Margin (OP/Sales): Efficiency of the firm's operations, this no. range from -90% to +90%, the higher the better.

2) Asset Turnover (Sales/Total Asset): Efficiency of the firm's assets in creating sales, this no. is usually 1.x, the higher the better.

3) Return on Equity (Net Profit/Equity): Rate of return attributed to shareholders, this no. is usually 5-40%, on average around 20%, the higher the better.

4) Return on Asset (Net Profit/Total Asset): Rate of return attributed to the whole firm, this no. is usually 2-30%, the higher the better.

5) Dividend Yield (Dividend per share/Share Price): Rate of return of dividends, this no. is usually 0% to 10%. In Singapore, anything higher than 5% is considered very good.

6) Other ratios that we talked about: PER, PBR, Net debt-to-equity, cash-to-market cap, EV/EBITDA.

7) Another 10,016 ratios that we did not talk about, created by Wall Street analysts. Maybe you can still find 1 or 2 useful ratios in there.

Essentially ratios are quite useful when you want to analyze a company but try not to be a cult leader and read into ratios religiously. By that I mean you try to contemplate if $12.5 per dishwashing session is more efficient that $12.6 per dishwashing session. They are useful but not that useful. They give a sense of how the company is performing, you still need to do more homework after that.

Wednesday, July 26, 2006

Cash and Debt

Perhaps the most important information that can be derived from analysing the balance sheet is whether the company has good financial health. This is determined by how much cash or debt the company holds.
Needless to say, a company that has no debt will be better than one that has. But what is the optimal level of debt? The academic answer will involve corporate finance and things like WACC (pronouced as "whack" as in the sound that is made when you use a baseball bat and smash it on your broker's forehead) which I hope to touch on in future, but not now. For a rough gauge, perhaps we can look at two simple ratios.
  1. Net Debt to Equity ratio
  2. Cash to Market Cap ratio
For a company that has debt, we first subtract cash from its debt to get its net debt level. Next we simply divide its net debt by its shareholders' equity. E.g. Firm A has $100 Debt but $20 Cash and $80 Equity. Hence Net Debt to Equity = (100-20)/80 = 1. This means that Firm A employs as much debt as equity to finance its business. (Which is not very good lah, imagine your wife borrows from you $1000 for every $1000 she has to buy a Prada bag!)
In Singapore, a company with a Net Debt to Equity ratio of 1 or 100% is considered very bad since most listed companies here has no debt. This is especially true for the best companies around.
Now if the company has no debt, then how much cash is enough? The other ratio that people look at is the Cash to Market Cap ratio. This is simply taking cash that the company holds divided by its market capitalization. I would say that a ratio above 20% would be considered very good. This ratio rarely goes above 50% because if it does, essentially you are buying for the company's operations at a 50% discount. (i.e. your wife propose to sell her total net worth to you for $100,000, she has $50,000 in her bank and you get a cut of whatever she makes for the rest of her working life. Sounds good huh?)
To illustrate further, imagine that a company has a Cash to Market Cap ratio of 100%. Essentially, you bought the company for free, because its cash would have paid you the amount you forked out, plus you get the company's business which will continue to generate cashflow FOC.

Wednesday, May 31, 2006

Price to book

This post is updated in 2023.

Besides the price earnings ratio, another widely use valuation metric is the price to book ratio, or PBR. This is simply price of the stock divided by its book value per share.

The book value of a stock is also called its shareholders' equity which is whatever that is left for shareholders after all its assets are sold and all its liabilities are paid off (shareholders' equity = assets - liabilities)

By right, a stock should never trade below its book value, because this means that we should sell everything the co. has, pay all its debt and distribute what is left back to shareholders, which is more than the stock price on the market. So theoretically, one can arbitrage when a stock trades below its book value.

To use another analogy, say some bloke is selling you his car for $5,000, but if you take out the tires, the engine, the stereo and all other parts and sell them separately, you get back $10,000. You tell the bloke this but he is still grateful that you bought the car at $5,000 anyway. Translating back to finance lingo, you just bought something for 0.5x PBR and made 100% profit. 

By left, stocks trade below book value for as many reasons as why your wife / husband refuses to let you meet your buddies / girlfriends for a drink-all-u-can / let-your-hair-down night out, and as Warren Buffett learned, buying each and every stock below book value does not guarantee good return.

See Price Earnings Ratio

Monday, May 15, 2006

Price Earnings Ratio, PER, P/E Ratio

How do you actually measure the cheapness of a stock? SMRT shares trade at $1.40 and NOL trades at $3.00, is SMRT cheaper than NOL? The answer is a big NO. The price of the stock does not tell you whether it is cheap or not. Sadly, I would say 99% of the 1st-time investors never knew how to calculate the value of a stock when they first started investing. And needless to say, they also never heard of the all-important P/E ratio.

The P/E ratio is the most widely used yardstick to value a stock (i.e. to see if the stock is cheap or expensive). It is simply the price of the stock divided by its earnings per share. E.g. SMRT trades at $1.40 today, and its expected EPS for 2007 is $0.08, if you divide $1.40 by $0.08, you get SMRT's P/E ratio which is 18x.

PER tries to determine the value of a product by dividing its price by its quality. Here the quality of the company is determined by how much money it makes.

To give a simple analogy, Car A and Car B sells for $10,000 and $20,000 respectively. (ok I know this is ridiculous, the cheapest car in Singapore sells for $30,000 and it is made in China, but this is just example, ok, example.) Car A saves $200 of petrol per year while Car B saves $500 of petrol per year after driving the same distance. Which is a cheaper car?

Answer: Car B, because the Price / Petrol Savings is lower for B ($20,000/$500 = 40) than A ($10,000/$200 = 50). Similarly, a stock with a lower P/E ratio is cheaper stock, because for a certain price, you are getting better quality (i.e. the company generates more earnings). Historically, P/E for major markets have fluctuated from 10 to 40. (40 during the IT bubble). P/E ratios of individual stocks can be as low as 2 or 3. This simple but effective rule has been proven to make money over the long run.

The P/E ratio might be the single most important no. in investment as it gives an investor a quick and fairly accurate sense of how much a company is worth. Over the years, analysts and academics developed other valuation metrics like EV/EBITDA, EVA (with a copyright) PEG ratio etc, but nothing beats the simplicity of P/E. Surprisingly, most retail investors probably never heard about this when they buy their first stock and mainstream business news fail to mention this important ratio most of the time.