Showing posts with label Valuation. Show all posts

Tuesday, July 12, 2011

The Many Faces of PE - DCF

A lot of people like to say that PE is not robust enough. Ultimately a company is the present value of its future cashflow and how does one simple ratio determine it? We need to have a full model of all it's future cashflow, discount it back to today's earnings, add it up and we have the true value of the firm. How can one simple no. like PE determine the true value of a company?

Well, actually, it kinda does a great job at that.

PE is actually not that different with DCF.

Let's start with DCF. DCF is basically discounted cashflow of a firm:

Discount rate: 6%, Growth: 2%

Yr 0 EPS $1.00 - DCF to Yr 0 = $1
Yr 1 EPS $1.02 - DCF to Yr 0 = $0.96
Yr 2 EPS $1.04 - DCF to Yr 0 = $0.93
.
.
.
Yr 28 EPS $1.74 - DCF to Yr 0 = $0.34
Yr 29 EPS $1.78 - DCF to Yr 0 = $0.33

The calculations above shows you that this firm earns $1 per share and increases it by 2% every year, and will continue to do so for 30 years. To calculate the value of the firm, we need to discount these future cashflow back to today. So you can see that in Yr 1, ie next yr, it is actually making only $0.96 in today's dollar, Yr 2 it's $0.93 and in Yr 29 it's $0.33 in today's dollar.

Now adding these up gives you $18, which should be the intrinsic value of the firm.

Incidentally, if you think of the inverse of PE, which is the earnings yield and compare it against the discount rate of 6%, you can say that the right PE for the firm is 1 divided 0.06 which is 17x.

Using this to calculate the intrinsic value, we use next yr's EPS of $1.02 multiply by 17x, which gives you $17.4, not so different from the $18 calculated using the complicated discount cashflow.

In fact, if we know that the firm will continue to grow 2% for 30 years, we should be using a higher EPS, maybe say a Yr 2 EPS, which will give you $17.7 intrinsic value, just 2% different with the DCF calculated value of $18.

So PE while simple, gives you a quick but somewhat accurate way to calculate the intrinsic value of a stock.

Of course, there are a few caveats here:

1. Why 30 yrs? Shouldn't a company exist forever?

Yes in the example above, DCF lasted only 30 yrs but in reality companies can exist longer than that. In fact, we need to do DCF for 100 years in order for the last few years to become small enough such that it doesn't matter. Alternative, most people will actually stop after 5 or 10 yrs, and put in a terminal value and discount that back to today. But in doing so, basically, we are applying the PE methodology on the terminal value, and this value actually constitutes a larger part of the final intrinsic value. So essentially, we are still using PE this way.

2. Shouldn't a company grow faster than 2%?

Yes that is true, but with our example, when we put in a high growth rate for 30 yrs, the no.s become astronomical and can't be justified rationally. This is the power of compound interest which we have also discussed. For example, if we put in 8% growth, intrinsic value becomes $40 after 30 yrs, that's 40x PE based on next yr's earnings. Hence for very long periods, like 30 yrs, we have to assume that the average growth is small.

3. What if we change the discount rate?

The discount rate is the most sensitive part of the whole DCF methodology, changing it slight would alter the picture significantly. For example, changing the discount rate from 6% to 4% brings the intrinsic value to $23 from $18. Which is why most people doing DCF usually put in a sensitivity table showing how the intrinsic value changes as discount rate changes.

Putting this altogether, I think the main message is: you can use DCF if you have a good grasp of the various assumptions going into it, ie the growth rate, discount rate and how things changes over the next 5, 10, 30 years. Now if someone can really get all these right, then perhaps he should be doing something greater, like save the world and be the next Messiah or something. Why bother investing money, which really doesn't add value to the society?

Well if all you want is to get a quick answer to a ballpark intrinsic value, using a ballpark EPS multiplied by a rational PE multiple (between 10-18x) would suffice in most cases.

Wednesday, June 15, 2011

The Many Faces of PE - Quality

This is the 3rd installment of posts titled "Many Faces of PE". The previous two posts are:

Growth
Shiller PE

It is important to bear in mind that PE can bear so many different faces bcos we look at just next yr's PE. This is a practice that the whole financial industry agreed on some time back even though it totally made no sense for investors. But it does help generate lots of trades and commissions though.

So when we just look at next yr's PE, peer comparsion and quality also comes into play.

4. Peer Comparison and Quality

Usually one would determine whether the stock is cheap vs its peers in the same industry. So when looking the PE of Singtel, we also look at Starhub and M1. The industry average PE would determine where some of these individual stocks should trade at.

Of course, in reality, this made little sense. If something is cheap, you don't have to compare it to confirm its cheapness. Vice versa, if something is expensive, you cannot try to justify buying its cheaper peer.

Say Singtel, it's PE is 11x, but do you say that Vodafone is 10x so Singtel is expensive and hence cannot buy?

On the 2nd point, RenRen, the facebook of China, if it IPO at 50x, do you say then it's cheap bcos Facebook is 100x?

I guess the point I am trying to make is that the absolute PE level is very important as well when we look at peers. If it's cheap, it's cheap. It is not very important talking about how cheap vs peers. At the big picture level, if the whole industry is cheap it probably means there is a lot of upside when the outlook changes ie buying anything in the industry will yield significant upside. As an example, in the midst of Lehman, UOB was trading at 0.7x Price to Book and DBS was 0.6x Price to Book. Did buying one over the other matter very much? UOB is up 2.3x since its Lehman low from $8 and DBS is up 2.4x from $6.

Vice versa for expensive names, if the whole sector is overpriced then owning any stocks in the sector meant huge downside risk if things go wrong. Just like during the dotcom boom, it doesn't matter if you got Amazon, one of the best dotcom firm and still going strong today, or lastminute.com, a fly-by-night dotcom firm that does not exist today. You would have lost 80% on Amazon and 100% on lastminute.com.

Having said that though,PE usually also tells the quality story. If Firm A has a better management, with more robust processes, better products vs Firm B, the market knows and gives Firm A a higher PE. Just as an example, the better quality Firm A might trade at 14x vs a poorer quality Firm B at 13x.

Next: PE vs DCF

Tuesday, June 07, 2011

The Many Faces of PE - Growth

This is a continuation of the previous post on the many ways to look at the PE ratio.

3. Growth Angle

As the investment world, led by brokers shifted to look at just 1 year PE ie PE using next year's earnings. A lot of imagination bloomed on how we can interpret this ratio. The most popular one being how PE can be used to tell the growth story. The rationale is simple enough: different companies and industries have different growth outlook. By looking at next yr's PE, we cannot just say that: ok, more than 15x is expensive, I am not going to buy anything more than 15x.

What if the industry is growing at 30% per year? Then 15x is cheap! By right, it should trade at 30x PE (see the rule of thumb below). Hence with this argument, basically the brokers can convince anyone to buy at any PE. The most recent case being Facebook, our most visited website nowadays. Facebook is being valued at USD 65bn, but its revenue is USD 1bn and profits probably half of that. This means that Facebook's PE is roughly 120x, yet investors are asking for more, they can't wait to buy it bcos on its first day of trading, it is bound to go up another 50%, ie its PE will hit close to 200x!

Well's that's the Greater Fool Game for you in Font Size 64.

But, back to reality, since the whole world looks at just next yr's PE, and it is the most accessible ratio, when we look at that number, we can also incorporate this growth angle mentality.

Basically the way I would look at it would be as follows (all based on just next yr's PE:

10x: either very cheap or the industry has no growth. Some telcos, nuclear stocks, dying industries trade at this PE

15x: Fairly valued, or cheap if growth is good (ie more than 20%).

20x: Expensive, very highly likely to lose money if we buy anything at 20x. The growth has to be 25% or more to justify this PE ratio.

25x: Nothing should trade above this (by right), no matter how good the prospects are. Think thrice if you want to buy a stock trading above 25x and then don't buy it. For more on this point, see this post: Valuation Expansion.

It is also industry rule of thumb to pay x multiple of x% of growth, ie if a stock is growing 15% we can pay 15x for it. There is no mathematical proof or strong financial concept behind this interpretation. It is, in every sense, just a rule of thumb. Some investors use this rule quite often. Even the value guys.

Of course this rule of thumb falls apart when the PE is too high or low. For eg, companies with no growth trades at 10x (usually), while Facebook which can probably grow 30-40% trades at 100x.

Hence I would usually demand more growth given the same PE. ie for PE 15x I hope to get 20% growth.

Next post: Quality!

Friday, May 20, 2011

The Many Faces of PE - Shiller PE

With the new Cabinet in place and the WP working hard to defend what they have won, it is time to get back to real investment! Today we look at our favourite ratio again!

PE or price earnings ratio has been talked to the death on this blog. This is more to just summarize the various ways to look at this ratio, or rather, how many in the investment community looks at it.

1. Cheap or Expensive

The PE ratio, first and foremost, is the quickest way to determine whether a stock is cheap or not. It is obviously not the best way, as most source will give the PE based on next year's earnings. Now why should it based on 1 yr's earnings is beyond me, given that business and the economy in general tend to go through cycles. In any case, we have discussed this about a million times. Here are a few of the earlier posts:

PE Ratio
Earnings yield

2. Shiller PE

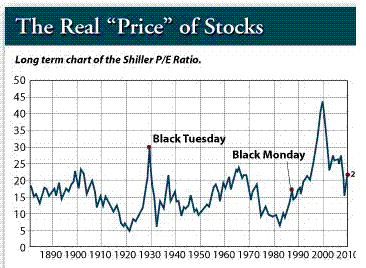
Well it appeared that it wasn't just me who thought that PE should be based on some long term earnings instead of just next yr's. So some professor named Shiller calculated PE based on 10 year's worth of earnings. Before him, of course, the Grandfather of Value Investing: Ben Graham had already advised everyone to use 10 year average in the 1960s. Sadly, nobody bothered. Well at least today Prof Shiller continues to maintain the database of PE based on 10 yr's earnings and below is the chart.


From the chart, you can see why no broker would want define PE using 10 year earnings. Bcos it shows you there is about 3 times in the last 100 yrs where stocks were truly on bargain, 1920, 1931 and 1982.

There is about 10 times where you can buy at 10x PE, which is still quite cheap, over the last 100 years. If you are a true value investor and you know it's risky to buy over 15x, basically, this chart tells you that you shouldn't have bought anything in the last 20 years.

So is it a wonder why nobody showed us this kind of PE calculation?

Ok you might argue that if this Shiller calculation did nothing in the last 20 years, and we missed that bull run in dotcom, and during 2006 and 2007 when China was the bull and the bulls were all in China, then maybe we shouldn't be looking at it at all?

That is true, but I guess the main purpose of using such conservative ratio would be to protect against any risk of losing a lot of money. The Shiller PE would more or less guarantee you that you will not lose money if you bought when it showed 10x. It cannot tell you to buy at 15x hoping it will go to 40x.

Next post we look at the other faces of PE!

Monday, August 30, 2010

Valuation Expansion

On Wall Street, a lot of educated monkeys like to talk about valuation expansion. Basically valuation expansion simply means that some stock trading at 15x PE should be trading at 25x PE bcos its industry is sexy, or the company has undergone transformation of its business to become the new growth story or some other cock-and-bull story.

So say the stock price today is $15, and the stock earns an EPS of $1 ie PE is 15x. Valuation expansion simply means that the stock should be $25 bcos PE should be 25x. The basis of this argument is that since the stock is in a growth industry, or has transformed its business, or watever crap reason, the future EPS is not just $1 but much higher. Since we are not sure what that would be, just give it a higher PE to justify this growth.

The ingenuity of this crap theory is that nothing changed, but the "value" of this stock just expanded 60%. This then can be used to justify buying the stock at any price bcos we can always assuming super normal growth and increase the valuation. We can even increase the target multiple further from 25x to 50x. This would expand the original "value" by 333%.

Let's just do a simple experiment the debunk this valuation expansion theory.

Yr 0 EPS $0.5 (Stock price $25, ie PE 50x)
Yr 1 EPS $1 (Stock price $25, ie PE 25x)
Yr 2 EPS $2
Yr 3 EPS $3
Yr 4 EPS $4
Average EPS $2.1
True intrinsic value (using PE 15x) = $2.1 x 15 = $31.5
Upside = $31.5/$25 = 26%
Upside per yr roughly 5%

So assuming today we are at Yr 0 and this company started out with an EPS of 50c but bcos of its super power growth, the stock market has already valued it at 50x PE current yr and 25x next yr. Of course this is assuming it didn't disappoint, its EPS doubled to $1. In fact it didn't disappoint for the next 4 yrs and its EPS grew from the initial 50c to $4. This stellar firm actually grew its earnings 8 folds in 5 yrs!

Now how spectacular can a normal company get? I would think this type of growth puts the world's best growth firm to shame. Look at APPL, the darling-est growth stock in our lives. Currently it's the 2nd biggest company in the world by market cap. Its net profit was $1.3bn 5 yrs ago. Last year, it was $8.3bn. The 5 yr growth alas is 6.4x, still a tad less than our hypothetical co. at 8x.

So 8 fold increase in EPS is really as good as it gets. But, if you have bought it for 25x or more, the return in stock price is likely to be single digit return. As I calculated, the intrinsic value is $31.5 vs today's price at $25. Of course, the stock might bounce up a lot, to say $50 then collapse, or it's price might continue to stay very much higher than its true value of $31.5, but we are value investors remember? We don't follow prices. We follow value.

What I am trying to say is this: when you buy a valuation expansion story, your rate of return is destined to be meager even if the story comes true. In our hypothetical case, the stock return over 5 yrs is about 5% per yr. How fantastic!

To me, valuation expansion is then just another variation of the Greater Fool Game. Valuation expansion means the earnings of the company is not great now, BUT bcos there are a lot of people willing to pay 25x now, therefore the stock price should rise by a huge magnitude.

I would think that a better way to make money would be the always buy below PE of 17-18x. Value investors would certainly do that. With valuation expansion, there is no margin of safety at all. What if the growth didnt come true? What if the genius CEO died?

So when you hear valuation expansion next time, pls beware!

PS: APPL did trade at 25x PE 5 yrs ago and you would have made a lot of money buying it at 25x 1 yr fwd and held it until today. But the better chance to buy was during the Lehman Crisis when the PE fell to 15x 1 yr fwd and you could have more than doubled your money in 2 yrs!

Sunday, June 03, 2007

Price Earnings Ratio and Earnings Yield (Again!)

One way of using Price Earnings Ratio (PER) is to look at its inverse: Earnings Yield. This has been discussed in a previous post, but I would like to emphasize the importance of Earnings Yield, hence the PER strikes back. Do not under-estimate the power of PER… Ok ok, let’s move on.

Earnings yield is the inverse of Price Earnings, meaning when I say I will only buy stocks with PER of 18x and below, I am actually saying I will only buy stocks with earnings yield of 5.6% and above. Or stocks that will give me 5.6% return over the long run. (1/18 is 0.056 or 5.6%, this is what I meant by the inverse)

Consider the China market now. Its PER is over 40x. This means that the Chinese farmers and the Chinese students are willing to buy stocks that will actually only give them 2.5% return (1/40 is 0.025 or 2.5%). They might as well put their money in fixed deposit in Singapore! The other time when the PER of a market reached 40x was during the dot com bubble. Of course, with bubbles, you can never know when it will break, so 40x can go even higher, to 100x. And with China, it may be possible bcos there are maybe another 800mn farmers and students waiting to open brokerage accounts. This is the perfect Greater Fool Game, if you are those who like to play this game.

Earnings yield can also be incorporated with the risk-free rate to calculate the equity risk premium, i.e. the excess return to investors who are willing to risk their money to get better return, hence a risk premium. Remember higher risk, higher return. For STI, the earnings yield currently is roughly 5% while the risk free rate is roughly 3%, so investors are being compensated an additional 2%, the equity risk premium, for investing in risky equities or stocks. That’s actually quite low by historical standards. Equity risk premium should be around 3-5% on average.

For the case of our lovely China, the risk-free rate is now roughly 3% while the market earnings yield is 2.5%. This means that the equity risk premium is actually negative! 2.5% minus 3% gives -0.5%. You are being penalized to invest in risky equities. This is higher risk lower return! What an ingenious break-through!

However, I must stress that a lot of this stuff is academic talk and offers little help in the real world, China’s equity risk premium can go to -3% for all you know, meaning the stock market can still double from current levels.

But earnings yield is a very handy concept to use when you want to gauge the potential return that you will get from your investment (if you hold for the long term). Next time you want to buy a stock with PER 30x, ask yourself, am I ok with this stock giving me a mere 3.3% return over the long term? I would advise you to go open fixed deposit!

Monday, May 15, 2006

Price Earnings Ratio, PER, P/E Ratio

How do you actually measure the cheapness of a stock? SMRT shares trade at $1.40 and NOL trades at $3.00, is SMRT cheaper than NOL? The answer is a big NO. The price of the stock does not tell you whether it is cheap or not. Sadly, I would say 99% of the 1st-time investors never knew how to calculate the value of a stock when they first started investing. And needless to say, they also never heard of the all-important P/E ratio.

The P/E ratio is the most widely used yardstick to value a stock (i.e. to see if the stock is cheap or expensive). It is simply the price of the stock divided by its earnings per share. E.g. SMRT trades at $1.40 today, and its expected EPS for 2007 is $0.08, if you divide $1.40 by $0.08, you get SMRT's P/E ratio which is 18x.

PER tries to determine the value of a product by dividing its price by its quality. Here the quality of the company is determined by how much money it makes.

To give a simple analogy, Car A and Car B sells for $10,000 and $20,000 respectively. (ok I know this is ridiculous, the cheapest car in Singapore sells for $30,000 and it is made in China, but this is just example, ok, example.) Car A saves $200 of petrol per year while Car B saves $500 of petrol per year after driving the same distance. Which is a cheaper car?

Answer: Car B, because the Price / Petrol Savings is lower for B ($20,000/$500 = 40) than A ($10,000/$200 = 50). Similarly, a stock with a lower P/E ratio is cheaper stock, because for a certain price, you are getting better quality (i.e. the company generates more earnings). Historically, P/E for major markets have fluctuated from 10 to 40. (40 during the IT bubble). P/E ratios of individual stocks can be as low as 2 or 3. This simple but effective rule has been proven to make money over the long run.

The P/E ratio might be the single most important no. in investment as it gives an investor a quick and fairly accurate sense of how much a company is worth. Over the years, analysts and academics developed other valuation metrics like EV/EBITDA, EVA (with a copyright) PEG ratio etc, but nothing beats the simplicity of P/E. Surprisingly, most retail investors probably never heard about this when they buy their first stock and mainstream business news fail to mention this important ratio most of the time.